
Consultation Report: Priorities for engagement, accessibility standards and research from 2020 to 2022
On this page
Alternate formats
1. Introduction
Our mandate is to develop accessibility standards and to support research to:
- identify barriers;
- remove barriers; and
- prevent barriers to accessibility.
The principle of “nothing without us” is at the heart of everything we do.[1] This means consulting Canadians to identify the accessibility priorities of persons with disabilities.
From September 1 to September 30, 2020, we held our first public consultations. We asked Canadians to help us determine, for the year 2021 - 2022:
- how to engage with Canadians;
- the research priorities for our next call for proposals; and
- the areas of focus for our next set of accessibility standards.
During the consultations, Canadians shared their thoughts via:
- an online survey;
- written or email submissions;
- phone interviews;
- social media; and
- other methods.
Our questions regarding priorities focused on the seven priority areas identified in the Accessible Canada Act:
- Employment
- Built environment
- Information and communication technologies
- Communication (other than information and communication technologies)
- Procurement of goods, services and facilities
- Design and delivery of programs and services
- Transportation
We promoted the consultations using many means of communication, such as:
- direct emails;
- social media posts;
- targeted social media advertising; and
- Canada.ca websites.
In total, we heard from 588 individual Canadians and organizations. Participants provided concrete suggestions from a variety of perspectives.
This report presents the key themes and priorities of those we heard from, with regards to:
- preferences for online and in-person engagement;
- priorities for accessibility research; and
- areas of focus for the creation of standards.
These findings will help inform decisions made by the Board of Directors about priorities for research and the development of standards in 2021 - 2022.
2. Data collection and method
A total of 588 participants provided their input throughout these consultations. This input was in the form of both quantitative and qualitative data. We analysed the qualitative data to identify themes. This report presents key findings from themes identified in the responses.
3. Who we heard from
During these consultations, we heard from a diverse group of 588 Canadians from across the country. Participants had the option to self-identify as a member of one or many stakeholder groups. They could also share other demographic data with us. This section presents a summary of our participants’ demographics.
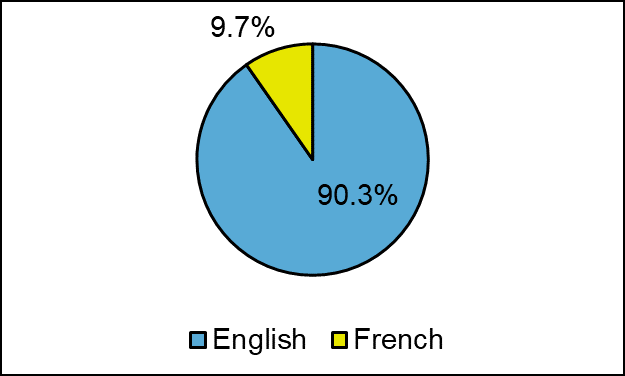
3.1 Responses by language
Participants could complete the survey in either official language. The participants’ chosen language may not reflect their first official language. Below is a breakdown of responses by language.
Table 1: Responses by language
| Language | % of responses |
|---|---|
| English | 90.3% |
| French | 9.7% |
Graph 1: Responses by language
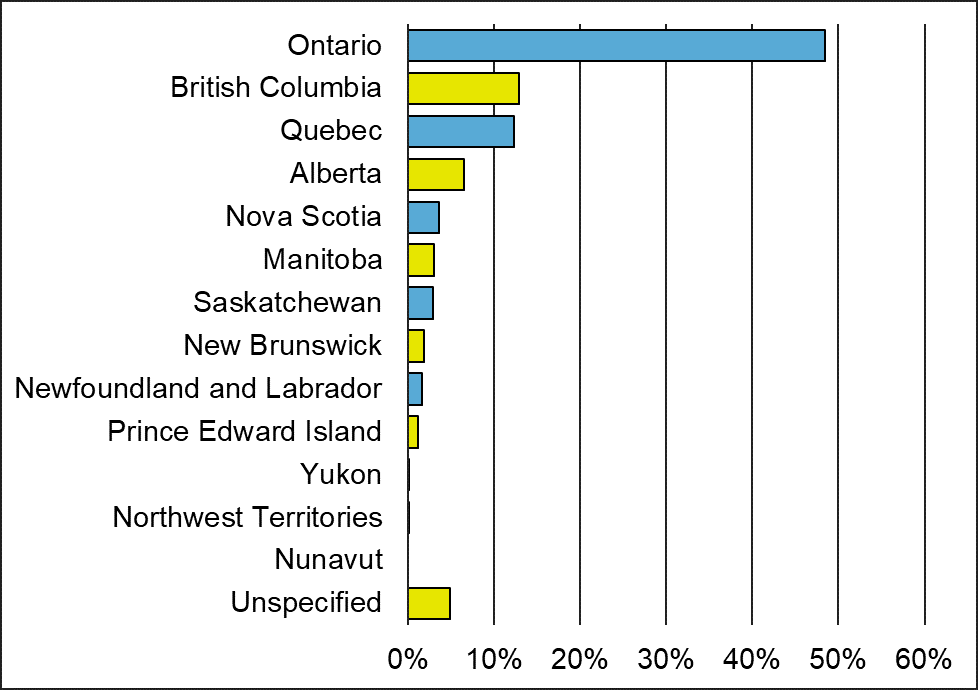
3.2 Responses by region
We asked participants to identify the province or territory where they live. Less than 5% participants chose not to disclose where they live. These results are proportional to the population of each province and territory, except for:
- Ontario (10.3% higher participation compared to their share of Canadian population);
- Quebec (10.1% lower participation compared to their share of Canadian population);
- Alberta (5.1% lower participation compared to their share of Canadian population); and
- Nunavut (0 participant, 0.1% lower participation compared to their share of Canadian population).
Table 2: Responses by province or territory
| Province / Territory | % of responses |
|---|---|
| Ontario | 48.5% |
| British Columbia | 12.9% |
| Quebec | 12.4% |
| Alberta | 6.5% |
| Nova Scotia | 3.6% |
| Manitoba | 3.1% |
| Saskatchewan | 2.9% |
| New Brunswick | 1.9% |
| Newfoundland and Labrador | 1.7% |
| Prince Edward Island | 1.2% |
| Yukon | 0.03% |
| Northwest Territories | 0.02% |
| Nunavut | 0% |
| Unspecified | 4.9% |
Graph 2: Responses by province or territory
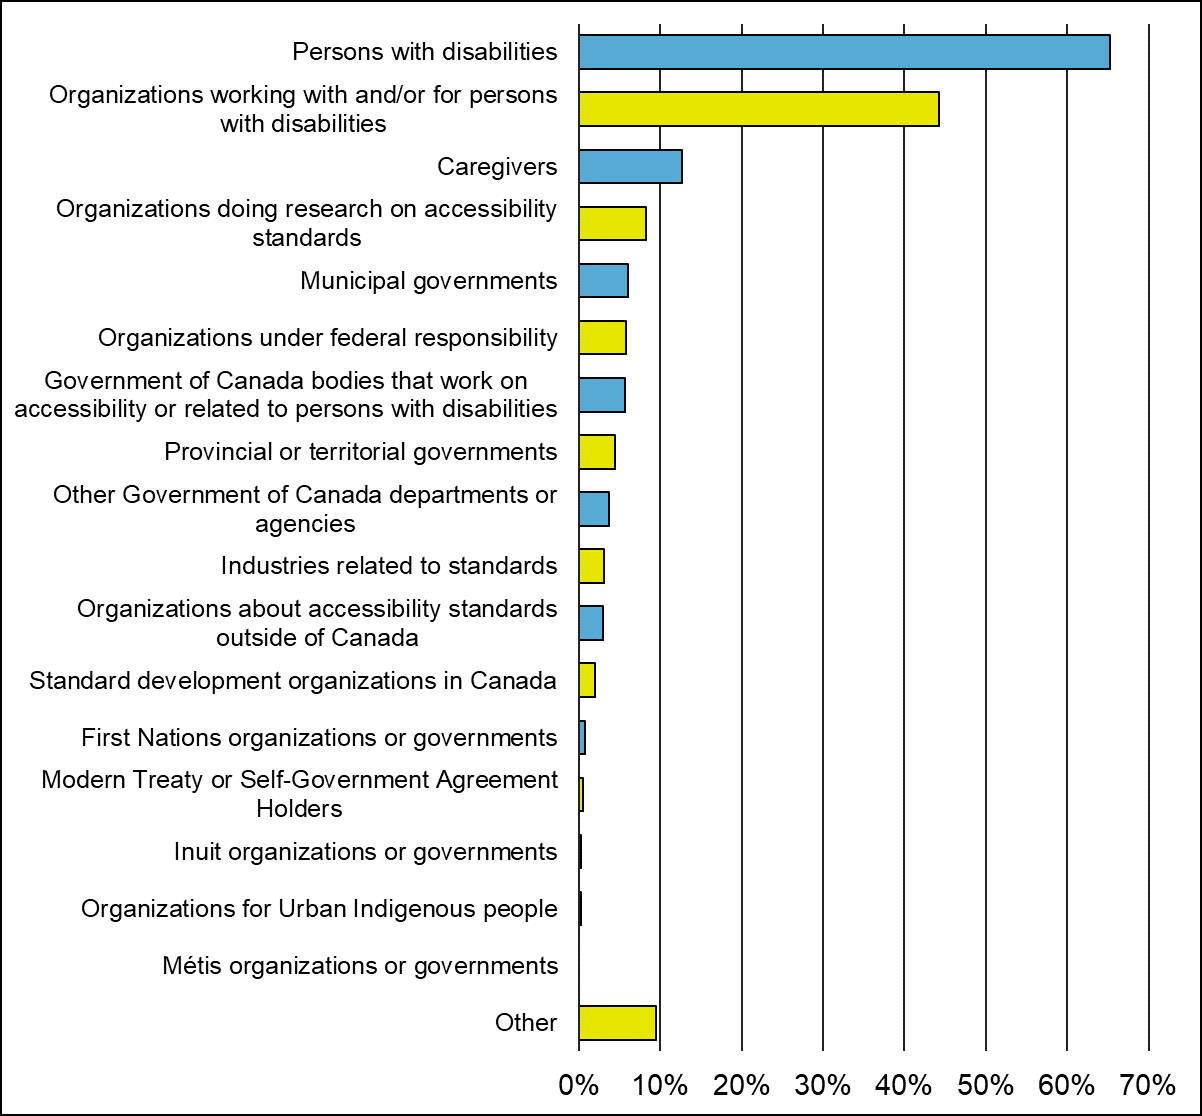
3.3 Responses by category of stakeholders
We asked participants to identify with one or many categories of stakeholders. Categories of stakeholders cover:
- persons with disabilities;
- organizations of, or providing services for, persons with disabilities;
- people affected by accessibility standards;
- people and entities we work with to apply standards; and
- people and organizations that use accessibility standards.
Participants also had the option to identify in other ways. Some chose to identify as:
- employment service providers;
- software designers;
- immigrant settlement organizations;
- labour unions;
- housing co-op organizations;
- consumer and public interest groups; and
- feminist disability organizations.
Table 3: Responses by stakeholder category
| Stakeholder category | % of responses |
|---|---|
| Persons with disabilities | 65.3% |
| Organizations of, or providing services for, persons with disabilities | 44.2% |
| Caregivers | 12.6% |
| Organizations doing research on accessibility standards | 8.2% |
| Municipal governments | 6% |
| Organizations under federal responsibility | 5.8% |
| Government of Canada bodies that work on accessibility or related to persons with disabilities | 5.6% |
| Provincial or territorial governments | 4.4% |
| Other Government of Canada departments or agencies | 3.7% |
| Industries related to standards | 3.1% |
| Organizations about accessibility standards outside of Canada | 2.9% |
| Standard development organizations in Canada | 2% |
| First Nations organizations or governments | 0.7% |
| Modern Treaty or Self-Government Agreement Holders | 0.5% |
| Inuit organizations or governments | 0.3% |
| Organizations for Urban Indigenous people | 0.3% |
| Métis organizations or governments | 0.0% |
| Other | 9.5% |
Graph 3: Responses by stakeholder category
4. Engaging Canadians
We asked Canadians to identify the methods of engagement they preferred. We also asked them to identify the accessibility features they need for online and in-person activities.
4.1 Preferences for online engagement
We told participants that we would offer the following features for virtual events:
- live translation;
- interpretation in American Sign Language (ASL) or Langue des signes du Québec (LSQ);
- closed-captioning or Communication Access Real-Time Translation (CART); and
- documents in alternative formats.
We asked if we should offer other online features.
- 65% of participants did not suggest more features.
- 35% of participants identified other features such as:
- plain language;
- access to internet or technology;
- meetings by video and recorded meetings;
- receiving documents in advance; and
- moderators with inclusive facilitation skills.
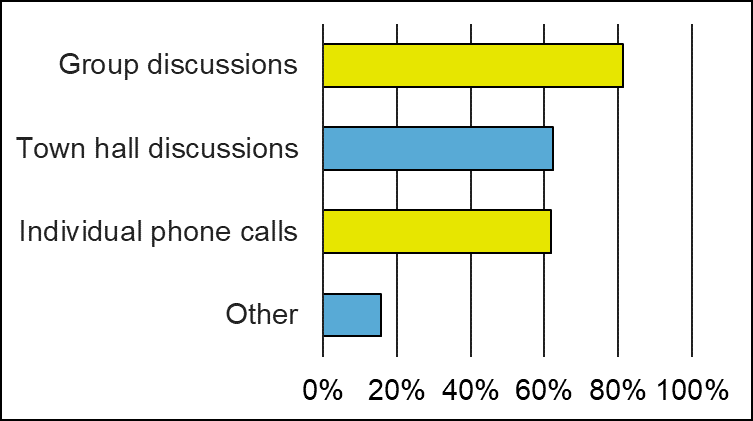
4.2 Preferences for in-person engagement
We showed a list of in-person activities to participants. We asked them to identify the ones they would prefer attending.
Table 4: Preferences for in-person activities
| In-person event type | Percentage of responses |
|---|---|
| Group discussions | 81.3% |
| Town hall discussions | 62.3% |
| Individual phone calls | 61.7% |
| Other | 15.7% |
Participants could also identify other activities. The following activities were identified by a great number of participants:
- video calls (recorded when possible);
- workshops and conferences;
- virtual town halls; and
- email and social media.
Graph 4: Preferences for in-person activities
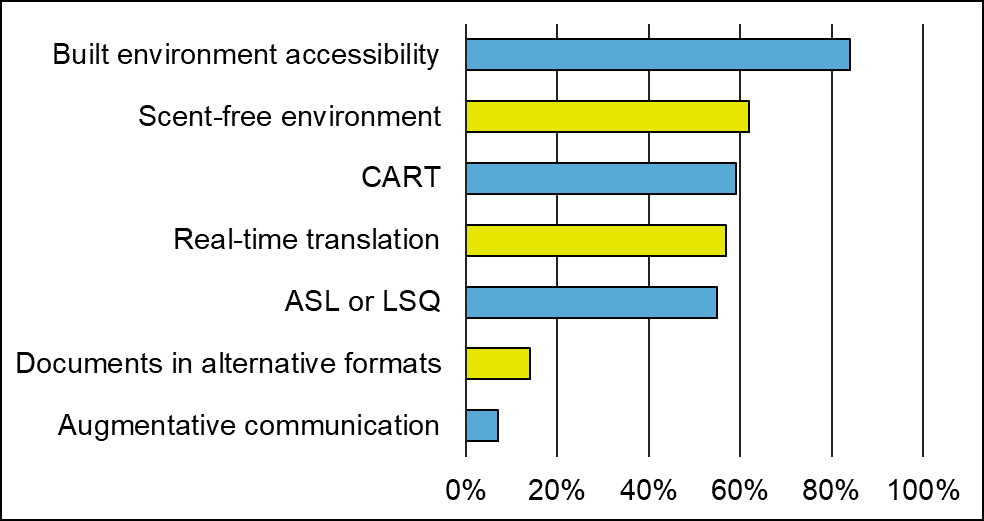
We asked participants about the types of in-person accessibility features we should offer. The following table shows the frequently mentioned features.
Table 5: Accessibility features for in-person activities
| Type of accessibility feature | Percentage of responses |
| Built environment accessibility | 84% |
| Scent-free environment | 62% |
| Communication Access Real-Time Translation (CART) | 59% |
| Real-time translation | 57% |
| American Sign Language (ASL) or Langue des signes du Québec (LSQ). | 55% |
| Documents in alternative formats | 14% |
| Augmentative communication | 7% |
Graph 5: Accessibility features for in-person activities
Participants had the option to give examples of documents in alternative formats they would need. We noted examples frequently mentioned, such as:
- large print;
- braille;
- digital copies of documents, like audio or text formats;
- accessible online platforms; and
- plain language.
Participants had the option to give examples of augmentative communication features. We noted examples frequently mentioned, such as:
- support staff, like interveners and personal support workers;
- having many virtual options for attending; and
- sensory considerations, like light and sound.
4.3 Preferences for engagement: other suggestions
We asked Canadians if they had other ideas to help us meet their accessibility needs. Participants provided many examples, such as:
- support staff;
- more breaks and time to sit down;
- providing resources in advance;
- accessible transit and parking;
- asking about accessibility needs in advance;
- sensory considerations, like light and sound;
- providing an option for virtual attendance;
- venues and washrooms that are accessible by wheelchair;
- plain language;
- visuals, transcripts and audio description;
- large print; and
- moderators with inclusive facilitation skills.
Participants told us to keep accessibility in mind when we design our activities. They also recommended us to test our documents and platforms with many tools to ensure compatibility.
5. Research priorities (2021 - 2022)
Our organization supports research about accessibility that:
- identifies barriers;
- removes barriers; and
- prevents barriers to accessibility.
We do this through the Advancing Accessibility Standards Research grants and contributions program. The research will inform accessibility standards in the future.
So far, the Advancing Accessibility Standards Research grants and contributions program has supported research projects in the areas of:
- employment;
- emergency measures;
- built environment (including parks and outdoor spaces);
- information and communication technologies;
- accessibility for Indigenous persons and communities; and
- accessible communications (other than information and communication technologies).
We asked Canadians to identify:
- which of our past research priorities needed more research; and
- which additional research priorities we should fund in 2021 - 2022.
5.1 Past research priority areas
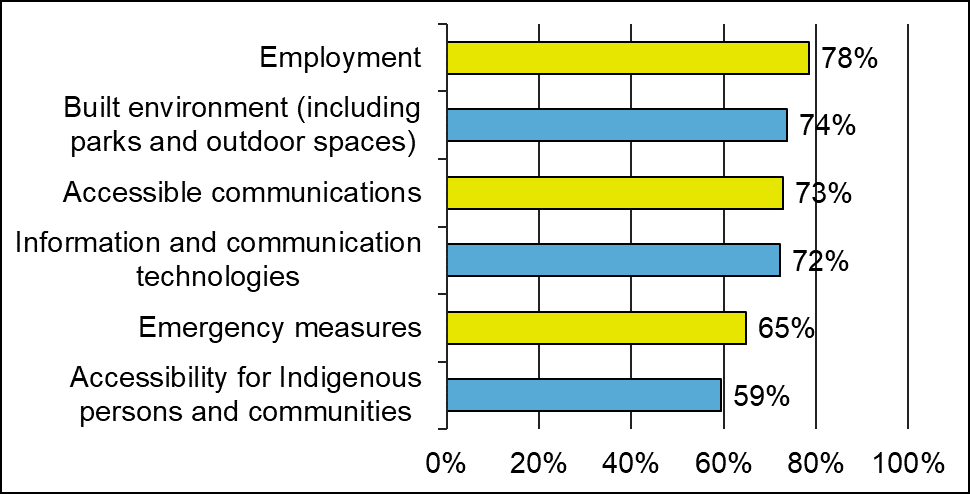
Our survey presented participants with our latest six research priorities. We asked them if we should keep any of these priorities for our next call for proposals (2021 – 2022).
At least 59% of participants supported each of our past research priorities. Employment gathered the most support among all past research areas.
Table 6: Support for past research priorities
| Research priority | Times selected (%) |
| Employment | 78% |
| Built environment (including outdoor spaces) | 74% |
| Accessible communications | 73% |
| Information and communication technologies | 72% |
| Emergency measures | 65% |
| Accessibility for Indigenous persons and communities | 59% |
Graph 6: Support for past research priorities
5.2 Participants’ ranking
To help us determine the research priorities for 2021 - 2022, we asked participants to rank their top three among the following seven priority areas:
Table 7: Participants' ranking of priority areas for research
| Research priority | Most important (%) | In top 3 (%) |
| Design and delivery of programs and services | 12% | 62% |
| Employment | 31% | 60% |
| Built environment | 23% | 52% |
| Information and communication technologies | 14% | 43% |
| Transportation | 5% | 33% |
| Procurement of goods, services and facilities | 5% | 26% |
| Communication (other than information and communication technologies) | 7% | 21% |
Graph 7: Participants' ranking of priority areas for research
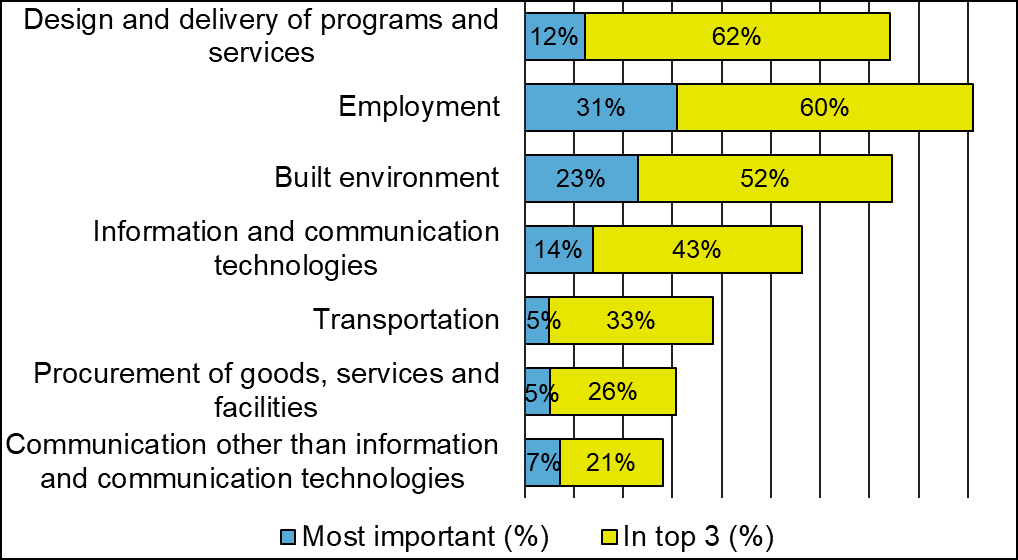
A majority of participants (31%) ranked employment as their top research priority. However, the design and delivery of programs and services appeared the most in participants’ top three (62%). Employment (60%) and the built environment (52%) were the two other research priorities that participants identified the most often in their top three.
5.3 Key themes
We asked participants to identify the accessibility barriers in areas under federal responsibility where there is a need for more research. Participants made suggestions for each of our seven priority areas. In everyday life, these areas often overlap with one another.
This section presents the main barriers featured in participants’ responses. We listed them by priority area and in order of recurrence.
Some of the barriers mentioned by participants are outside of federal responsibility. For example:
- public transit; and
- poverty and the cost of accessible technology and services.
This input is not included in this report. However, when possible, we will share this feedback with the relevant organizations.
5.3.1 Employment
Most participants chose employment as the number one research priority. In general, participants asked us to support research on the themes below.
- Accessibility features in the workplace, such as:
- the built environment;
- devices and technology; and
- flexible schedules.
- Hiring, retention and promotion, such as:
- more representation of both persons with visible and invisible disabilities; and
- quotas for employment.
- Mindset barriers in the workplace, such as:
- unconscious biases; and
- discrimination in the workplace.
- Application and onboarding processes, such as:
- accessible forms when applying to jobs;
- access to accessibility features during interviews; and
- opportunity to identify as a person with disabilities in the hiring process.
- Training for employers on issues, such as:
- accessibility features in the workplace; and
- mindset barriers and unconscious biases.
- Access to education and training for persons with disabilities, such as:
- Accessible and inclusive training; and
- Funding for training and career development
- Invisible disabilities in the workplace, such as:
- Better accessibility features for persons with invisible disabilities; and
- Barriers about the perception of invisible disabilities
5.3.2 Built environment
This section covers the themes identified for the built environment. Barriers to mobility were the most frequently mentioned. In this section, participants also made links with other areas like employment.
In general, participants asked us to support research on the themes below.
- Mobility and wheelchair accessibility, including:
- doorway widths;
- ramps;
- washrooms; and
- outdoor areas.
- Wayfinding and signage, such as:
- audible signs;
- tactile signage and cues (braille, textures); and
- other wayfinding technology.
- Parks and other outdoor spaces.
- Invisible disabilities and the built environment, such as:
- environmental sensitivities; and
- excessive noise.
- Accessibility of heritage buildings, such as:
- not making exemptions for heritage buildings; and
- ensuring that persons with disabilities have barrier free access to culture and history.
5.3.3 Information and communication technologies
In general, participants asked us to support research on the themes below.
- Accessibility training for a variety of online applications, websites and programs
- Closed captioning and Communication Access Real-Time Translation (CART)
- Website and mobile application accessibility
- Best practices and resources for accessible technology
5.3.4 Communication other than information and communication technologies
People communicate in many ways. In this section, participants named barriers they face when trying to communicate. This section focusses on barriers that are not related to technology.
In general, participants asked us to support research on the 4 themes below.
- Plain language
- Access to alternative means of communication, including access to many options
- Tools used to communicate, such as:
- assistive listening devices;
- speech-to-text tools and software; and
- technology to assist reading.
- Document accessibility, such as:
- Word document formats;
- PDFs; and
- forms.
5.3.5 Procurement of goods, services and facilities
Participants did not identify any themes under the responsibility of the federal government in this area.
5.3.6 Design and delivery of programs and services
In general, participants asked us to support research on the themes below.
1. Involvement of persons with disabilities in the design and delivery of programs and services
2. Intersections of disability with other underrepresented groups
3. Invisible disabilities
4. Testing and evaluation of accessibility for programs and services, such as:
- user testing; and
- evaluation tools and best practices for accessibility assessments.
5. Affordability and funding of programs and services.
5.3.7 Transportation
Participants mainly identified themes that are not under the responsibility of the federal government in this area.
The Government of Canada is only responsible for accessibility in the federal transportation network (e.g., airlines, interprovincial travel).
The one area frequently mentioned which falls under federal responsibility is the accessibility of airports.
6. Areas of focus for the creation of accessibility standards (2021 - 2022)
We are currently creating accessibility standards in the following areas:
- plain language (communication);
- outdoor spaces (built environment);
- emergency egress (built environment); and
- employment.
As part of our consultations, we asked Canadians to help us identify:
- the most important areas of focus for creating standards; and
- the barriers to accessibility our next set of standards should address.
6.1 Participants’ ranking
All seven priority areas identified in the Accessible Canada Act are important for Canadians with disabilities.
We asked participants to rank their top three priority areas:
Table 8: Participants’ ranking of priority areas for the creation of standards
| Priority area | Most important (%) | In top 3 (%) |
| Employment | 32% | 62% |
| Built environment | 26% | 58% |
| Design and delivery of programs and services | 11% | 50% |
| Information and communication technologies | 11% | 40% |
| Transportation | 6% | 37% |
| Procurement of goods, services and facilities | 5% | 27% |
| Communication (other than information and communication technologies) | 8% | 24% |
Graph 8: Participants’ ranking of priority areas for the creation of standards
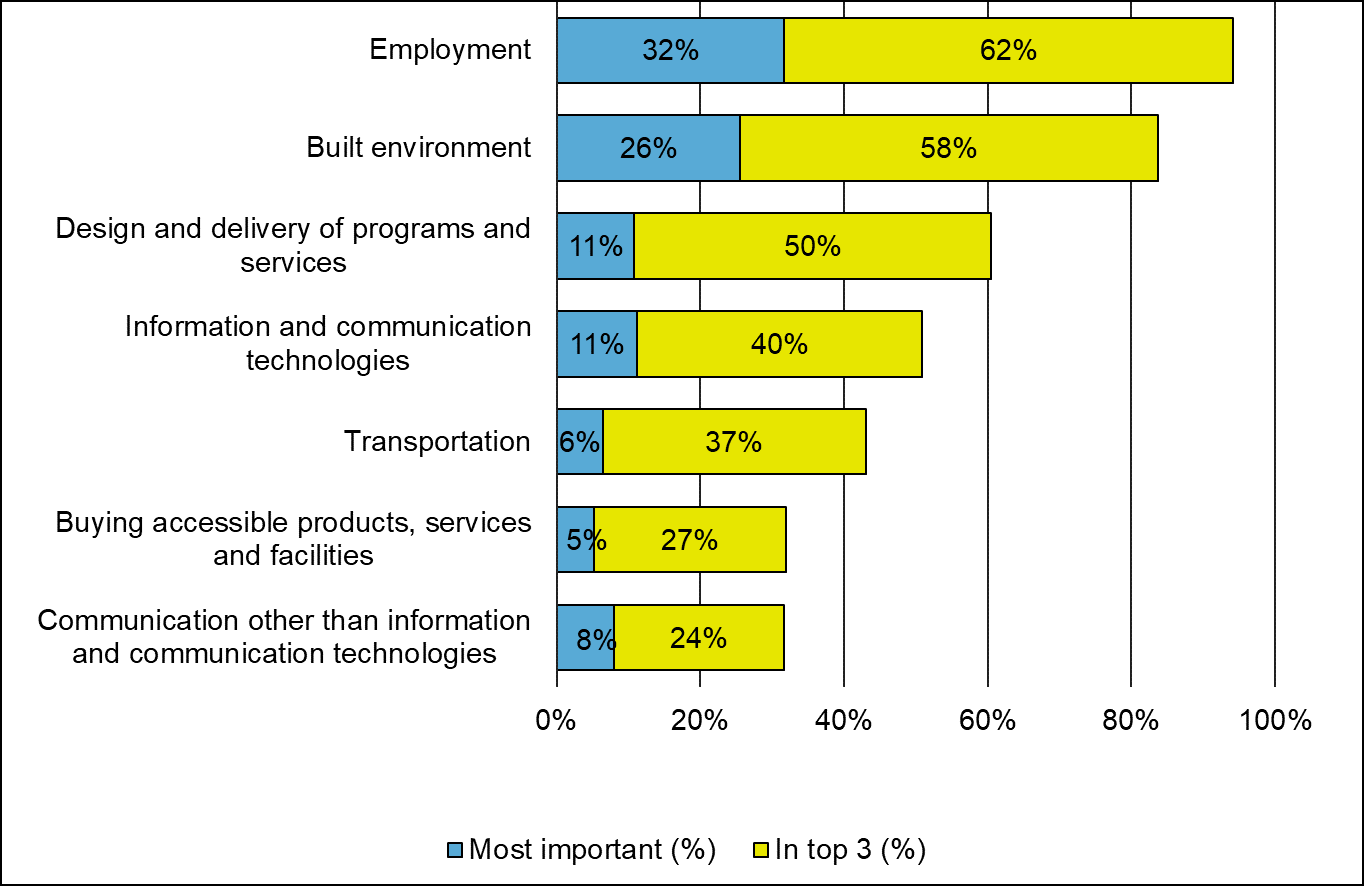
The priority areas that participants identified most often as their first choice are:
- employment (31%);
- built environment (26%);
- design and delivery of programs and services (11%); and
- information and communication technologies (11%).
The same priority areas appeared the most often in participants’ top three:
- employment (62%);
- built environment (58%);
- design and delivery of programs and services (50%); and
- information and communication technologies (40%).
6.2 Key themes
The seven areas under the Accessible Canada Act touch on many aspects of the lives of Canadians. In everyday life, they often overlap with one another. We asked participants to identify the accessibility barriers for standards development.
This section presents the main barriers featured in participants’ responses. We listed them by priority area and in order of recurrence.
Some of the barriers mentioned here fall outside of federal responsibility. For example:
- public transit; and
- poverty and the cost of accessible technology and services.
When possible, we will share this feedback with the relevant organizations.
6.2.1 Employment
Participants identified the following priorities for the development of standards under this theme.
1. Accessibility features in the workplace, such as:
- the built environment;
- flexible schedules; and
- access to accessible technology.
2. Barriers related to attitudes in the workplace, such as:
- discrimination;
- ignorance; and
- lack of awareness training.
3. Recruitment, retention and promotion, such as:
- accessibility features in the hiring process;
- not enough hiring of persons with disabilities; and
- not enough persons with disabilities in management or executive roles.
4. Inadequate support programs, such as barriers to meeting eligibility criteria for benefits
6.2.2 Built environment
The built environment is the human-made physical environment in which people live, work, and play. It includes:
- workplaces;
- parks;
- recreation areas; and
- transportation systems.
Participants identified many barriers in this area. The main one was the lack of universal design. Universal design means taking into account all disabilities in the design of buildings and outdoor spaces.
Participants identified the following priorities for the development of standards under this theme.
1. Universal design, with a focus on barriers related to:
- mobility needs, including:
- space;
- elevators;
- ramps; and
- automatic doors.
- sensory needs, including:
- lighting, sounds, textures, and scents;
- visual, auditory, and tactile cues; and
- sensory overload.
2. Wayfinding, such as:
- visual signage and cues (symbols, large print, contrast);
- audible signage and cues; and
- tactile signage and cues (braille, textures).
3. Accessible washrooms, including:
- ample space for caregivers;
- adult change tables; and
- mechanical lifts.
4. Recreational and outdoor spaces, such as:
- national parks; and
- weather and winter-accessible spaces.
6.2.3 Information and communication technologies
Information and communication technologies are important tools that help us access information.
Participants identified the following priorities for the development of standards.
1. Documents in alternative formats, such as:
- print;
- plain language; and
- visual aides (images).
2. Training and guidelines for creators of content and devices
3. Web accessibility, including respecting Web Content Accessibility Guidelines (WCAG) 2.1 AA
6.2.4 Communication other than information and communication technologies
Participants identified the following priorities for the development of standards.
1. Access to accessible communication tools, such as access to many communication options like:
- in person;
- on the phone;
- in writing; and
- online.
2. Plain language
3. Accessible and alternative documentation, such as:
- web accessibility;
- print;
- braille; and
- allowing e-signatures.
4. Availability of interpretation in American Sign Language (ASL) and Langue des signes du Québec (LSQ)
5. Training and awareness, such as training about:
- non-verbal communication; and
- using alternative and augmentative communication devices.
6.2.5 Procurement of goods, services and facilities
Procurement means buying goods, services and facilities. Participants said that they face many barriers to accessibility in that area.
The main barrier was the availability of accessible goods, services and facilities.
Participants also said that federal procurement processes were important tools for increasing the adoption of accessibility best practices.
Finally, they raised the importance of accessible banking and online banking.
6.2.6 Design and delivery of programs and services
Participants identified the following priorities for standards development.
1. Involvement of persons with disabilities in the design and delivery of programs and services
2. Financial barriers, including for:
- persons with disabilities in accessing services; and
- service and program providers in providing accessibility features.
3. Availability of best practices and resources on universal design
4. Attitudinal barriers, including:
- ignorance; and
- unconscious biases.
5. Web accessibility, for web-based delivery of programs and services
6. Universal design, including having access to many options when using programs and services, such as:
- in-person;
- online; and
- on the phone.
6.2.7 Transportation
Participants identified the following priorities for the development of standards.
- Access to accessible vehicles
- Training for staff and providers
7. Overarching themes
Earlier sections showed themes that participants mentioned the most often. Yet, other themes stood out because:
- they appeared in both research priorities and areas of focus for the creation of standards; and/or
- they appeared under most or all priority areas.
This section presents these overarching themes.
7.1 Mindset barriers
Under every priority area, participants mentioned barriers such as:
- prejudice;
- unconscious biases; and
- lack of awareness.
7.2 Consistency across Canada
Many participants said that the barriers they face vary based on the province or territory they are in. They said it was important for accessibility to be consistent across Canada.
7.3 Intersectionality
Participants stressed the need to include the perspectives of all persons with disabilities. This includes persons with disabilities who belong to one or many of the following groups:
- First Nations, Inuit, or Métis communities;
- LGBTQIA2S+[2] community;
- racialized groups;
- women;
- youth;
- seniors;
- new Canadians; and
- people in rural and remote areas.
Participants noted that persons with disabilities in these communities can face more challenges. They also said that they can view accessibility in different ways. For these reasons, they said it was important to involve them in our work.
7.4 Including persons with disabilities in decision-making and every step of the way
Many participants stressed the importance for us to:
- listen to the lived experiences of persons with disabilities; and
- involve them as we create accessibility standards.
7.5 The time for action
Some participants told us that Government has done enough consultations. They told us they wanted us to act now to create an accessible Canada for all. We are currently working on four standards and planning our next set. The seven areas under our mandate are important in many aspects of the lives of Canadians. Our goal is to create standards for all seven areas by focussing on new ones each year. We needed to consult Canadians to get their input, which will help us determine which standards to address first.
7.6 Learning from best practices in provinces and other countries
Many participants encouraged us to look at the work of provinces and other countries on accessibility, including on:
- standards;
- regulations; and
- legislation.
They gave us examples that could be good for creating our own standards. We are currently reviewing best practices in provinces and other countries. We are taking good note of the many examples participants gave us.
8. Lessons learned
The ‘nothing without us’ approach is at the heart of everything we do. We want to involve persons with disabilities in the creation of accessibility standards.
Public consultations are an important part of this approach. We want our consultations to be meaningful, accessible, and inclusive. As a new organization, our goal is to always improve on our public engagement efforts.
Many participants took the time to provide feedback on the way we engaged with them this time. This section summarizes the lessons learned from this consultation process.
8.1 Accessibility and usability
We heard from a majority of persons with disabilities. Many of them told us about features that had an impact on the accessibility of our consultations, such as:
- the length of our survey;
- the availability of accessible alternatives;
- compatibility with some accessible technologies like screen readers; and
- consultation fatigue.
The accessibility of our consultations is very important to us. We want to ensure that all Canadians can take part in our work without facing barriers. We will apply the lessons we learned in our future engagement activities.
Because of COVID-19 restrictions, we used online engagement tools. If context and budget permit, we will look at other options in the future. This would allow for people who don’t have access to Internet to participate.
8.2 Demographics
We asked participants to self-identify in one or many of our stakeholder categories. We also asked them to identify the province or territory where they live. This gave us some information about them, but not enough to get to know our stakeholders in all their diversity.
It is important to know who our initiatives are reaching to ensure we hear the voices of diverse groups such as:
- First Nations, Inuit, or Métis communities;
- LGBTQIA2S+[3] community;
- racialized groups;
- women;
- youth;
- seniors;
- new Canadians; and
- persons with disabilities living in rural and remote areas.
We will need to ask more demographic questions to our stakeholders in our future initiatives. This will help us in adapting our strategies so that we hear diverse perspectives, including those of underrepresented groups.
9. Conclusion
We want to thank the passionate Canadians and organizations who took the time to take part in our consultations. Your feedback will help us provide recommendations to the board of directors. The Board will then determine, for the year 2021 - 2022:
- how they will organize their first annual public meeting;
- research priorities for our Grants and Contributions program; and
- areas of focus for the creation of standards.
The ‘nothing without us’ approach is at the core of our mandate. Engaging with Canadians will remain a priority for 2021 - 2022. Your participation is crucial to ensure the research we fund and the standards we tackle address the most pressing accessibility barriers.
We will keep improving our engagement activities so that we can keep Canadians involved in our work. Together, we will build an accessible Canada for all.
Footnotes
[1] Like the Accessibility Strategy for the Public Service of Canada, we are adopting the "Nothing without us" motto, because everything should consider accessibility. This moto really embodies the spirit of consultation that is central to the Accessible Canada Act, from which our organization was born.
[2] Lesbian, gay, bisexual, transgender, queer or questioning, intersex, asexual, two-spirit, and more.
[3] Lesbian, gay, bisexual, transgender, queer or questioning, intersex, asexual, two-spirit, and more.